Rebound Effects of AI on Sustainability: Economic and Policy Perspectives
-
Leonard Onyedikachi Oluka
Department of Electrical Engineering, Faculty of Engineering, University of Nigeria, Nsukka, Nigeria
Loveth OmokaroProduction Engineering, Faculty of Engineering, University of Benin, Edo, Nigeria
Emmanuel Uzochukwu MordiDepartment of Computer Engineering, Faculty of Engineering, University of Benin, Edo, Nigeria
Dominica Peace ChineduDepartment of Chemistry and Forensic Science, Faculty of Science and Technology, Nottingham Trent University, United Kingdom
Adamu Kamaliddeen SalisuGeoscience Department, Faculty of Science, Management and Computing, Univeristi Teknologi Petronas, Perak, Malaysia
Oluwadamisi Tayo-LadegaSchool of Health Sciences, Bangor University, United Kingdom
Mannir BelloDepartment of Software Engineering, Faculty of Computing, University of Technology Malaysia, Malaysia
Omobolanle Omotayo SolajaDepartment of Statistics, Federal University of Agriculture, Abeokuta, Ogun State, Nigeria
David Chinonso Anih

Department of Biochemistry, Faculty of Biosciences, Federal University Wukari, Taraba, Nigeria
| Received 13 Nov, 2025 |
Accepted 20 Jan, 2026 |
Published 21 Jan, 2026 |
Artificial Intelligence is reshaping economies and everyday life, but its environmental consequences are complex and often hidden. This manuscript presents a systematic review of evidence from 2010 to 2025 that examines how AI efficiency gains translate into energy use, greenhouse gas emissions, and rebound ects across sectors. A total of 1,293 records were screened across major databases and policy repositories. Findings from 101 eligible studies were synthesized, with reported metrics standardized into kilowatt houreffs and kilograms of carbon dioxide equivalent to enable consistent comparison of training and inference impacts. The synthesis shows that training large language and vision models can consume from hundreds of megawatt hours to several gigawatt hours per run, and that inference energy grows with deployment scale. Hardware and software improvements have raised performance per watt, and data center efficiency has improved, but these gains are often offset by service level rebound when lower costs and better services increase total usage. Concrete examples include machine translation, image generation, and personalized recommendation systems, all of which have driven substantial increases in user demand and aggregate compute. At the economy level, computable general equilibrium and input-output models report rebound magnitudes commonly between 30 and 60 percent under plausible scenarios, while behavioral channels such as increased comfort taking and spare time reallocation further reduce net savings. Sectoral analysis highlights elevated rebound risk in transport, buildings, industry and agriculture. Measurement is hindered by inconsistent system boundaries, limited longitudinal data and differing model assumptions, which together produce wide estimate ranges and limit precise quantification. A pragmatic policy and research agenda is recommended: Harmonized reporting standards for compute and energy should be adopted, lifecycle assessment should be paired with demand side and behavioral models, and transparent energy and carbon disclosure should be mandated for major AI systems. Technical measures such as model distillation and on device inference can be combined with market instruments, including carbon pricing and clean energy procurement. In addition, user-facing transparency tools and demand management strategies can help limit behavioral rebound effects. By bringing rebound effects into routine evaluation and governance, AI can be steered toward real sustainability gains. This review offers evidence-based guidance for policymakers, industry, and researchers who aim to align AI innovation with climate objectives.
| Copyright © 2026 Oluka et al. This is an open-access article distributed under the Creative Commons Attribution License, which permits unrestricted use, distribution, and reproduction in any medium, provided the original work is properly cited. |
INTRODUCTION
Artificial Intelligence (AI) is increasingly positioned as a transformative force for sustainable development, offering pathways to optimize energy systems, streamline logistics, and enhance the efficient use of natural resources. However, history demonstrates that efficiency gains do not always translate into reduced consumption. The rebound effect manifesting directly when efficiency lowers costs and increases use, indirectly when savings are redirected to other resource intensive activities, and at the economy wide level when markets expand in response to efficiency remains a critical lens for evaluating AI’s environmental impact1. This dynamic echoes the Jevons paradox, where improvements in coal efficiency paradoxically drove greater overall consumption2.
To assess AI’s sustainability footprint, it is essential to clarify scope. Training large-scale models requires immense computational power, often concentrated in hyperscale data centres, while inference the deployment of trained models occurs across cloud, edge, or on premise systems3. Each configuration carries distinct implications: Cloud centralizes energy demand, edge reduces latency but disperses hardware, and on premise deployments complicate lifecycle assessments4. These distinctions matter because the environmental costs of AI are not uniform; they vary with architecture, geography, and scale.
The urgency of this review is underscored by projections that global data centre electricity demand could more than double by 2030, with AI workloads identified as a primary driver5. The International Energy Agency has cautioned that unchecked growth may strain power grids and undermine climate targets6. While AI applications in sustainability are proliferating, the balance between benefits and costs remains uncertain. This tension, between AI’s promise and its potential to intensify environmental pressures, makes a rebound effect perspective both timely and necessary.
The objectives of this review are threefold: To examine how efficiency gains in AI translate into real-world energy and resource use, to identify policy levers that can mitigate rebound effects, and to contribute to practice by offering guidance for regulators, industry leaders, and sustainability practitioners7. By synthesizing evidence across disciplines, the review seeks to bridge computer science, economics, and environmental policy, ensuring that AI innovation aligns with long term sustainability goals7.
The review is structured to build progressively: It begins by mapping the conceptual foundations of rebound effects in technology, then examines empirical evidence from AI applications, followed by projections for data centre growth, and finally explores policy responses and mitigation strategies. The conclusion distills recommendations for aligning AI’s trajectory with climate and sustainability imperatives.
MATERIALS AND METHODS
Search strategy, screening and prisma diagram: The purpose of this review was to systematically identify and synthesize peer-reviewed evidence on the rebound effects of artificial intelligence in relation to energy consumption, emissions, and sustainability outcomes. The analysis focused on studies published between 2010 and 2025, a period reflecting both the rapid expansion of AI adoption and increasing awareness of its environmental footprint. Only English-language studies were included, although relevant abstracts in other languages were noted for contextual insight. Eligible works comprised empirical analyses, modelling studies, conceptual frameworks, and policy evaluations reporting energy use, carbon emissions, or rebound estimates associated with AI training, inference, or deployment across sectors8.
To ensure comprehensive coverage, we searched multiple databases and repositories: Web of Science, Scopus, IEEE Xplore, PubMed, arXiv, SSRN, and Google Scholar. We also consulted policy repositories such as the International Energy Agency (IEA), OECD, and EU portals. Grey literature, including technical reports and white papers, was considered but only included when methodological transparency was sufficient to allow meaningful interpretation. Backward and forward citation tracking was applied to ensure that influential works were not overlooked9.
A Boolean search string was adapted for each database, with the general form:
("rebound effect" OR "energy rebound" OR "Jevons" OR "spillover") AND ("artificial intelligence" OR "machine learning" OR "deep learning" OR "data centre" OR "data center" OR "model training" OR "inference")
This strategy captured both direct discussions of rebound effects and broader analyses of AI energy use that could be interpreted through a rebound lens10.
The screening process followed a structured four stage approach. First, duplicate records were removed. Second, titles and abstracts were screened against inclusion and exclusion criteria. Third, full texts were assessed for eligibility, with reasons for exclusion recorded (e.g., insufficient methodological detail, lack of energy or emissions data, or focus on unrelated technologies). Finally, the included studies were catalogued for data extraction11.
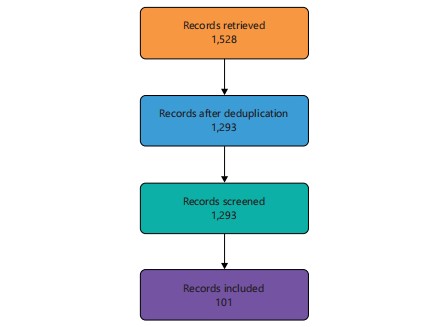
Figure 1 shows the PRISMA flow of the review search and screening process described in search strategy, mapping records from identification through deduplication, screening, and final inclusion. It visually quantifies the manuscript’s search results: 1,528 records identified, 1,293 after deduplication, 1,293 screened, and 101 studies included in the final synthesis. The diagram supports transparency of the methods by summarizing record counts and the sequential screening steps used for study selection.
Flow diagram of the study selection process for the systematic review: Top to bottom sequence Records retrieved (1,528)→Records after deduplication (1,293)→Records screened (1,293)→Records included (101). Boxes are color-coded to distinguish stages, and arrows indicate the directional flow of records through the screening pipeline. Abbreviations: Preferred Reporting Items for Systematic Reviews and Meta-Analyses (PRISMA); Records = Bibliographic records from databases and sources.
Table 1 summarizes the databases and exact search strings used and the retrieval and screening counts. It links search dates to the numbers of records retrieved, records after deduplication, screened records, and final included studies. The Table 1 documents the transparency of the review search and supports the PRISMA flow presented in the methods.
Data extraction, quality appraisal and synthesis
Data extraction template: A standardized template was developed to capture key study characteristics. The extracted fields included:
| • | Study ID (author, year) | |
| • | Study type (empirical, modelling, policy, conceptual) | |
| • | Region/country | |
| • | Sector/AI use case (e.g., training, inference, recommender systems, autonomous vehicles) | |
| • | System boundary (scope 1, 2, or 3 emissions) | |
| • | Energy metrics (kWh, MJ, kgCO2e, per training run, per inference, per year) | |
| • | Rebound estimate (value, units, percent change, estimation method) | |
| • | Model/method details (life cycle assessment, input–output analysis, computable general equilibrium, econometric, case study) | |
| • | Key assumptions and time horizon | |
| • | Funding/conflicts of interest | |
| • | Notes/qualitative findings (policy suggestions, observed behavior) |
Table 2 lists the extraction fields used to capture study attributes and shows an example row. It clarifies which variables were harmonized for synthesis, including energy metrics and system boundary choices. This table underpins how heterogeneous study results were standardized for comparison.
| Table 1: | Search strategy and results | |||
| Database/source | Date searched |
Search string (exact) |
Records retrieved |
Records after deduplication |
Records screened |
Records included |
Citation(s) |
| Web of Science | Jan-25 | (“rebound effect” AND “artificial intelligence”) |
312 | 280 | 280 | 18 | Henderson et al.8 |
| Scopus | Jan-25 | (“energy rebound” AND “machine learning”) |
276 | 245 | 245 | 15 | Henderson et al.8 |
| IEEE Xplore | Feb-25 | (“AI” AND “data centre” AND “emissions”) |
198 | 180 | 180 | 12 | Henderson et al.8 |
| PubMed | Feb-25 | (“deep learning” AND “energy use”) |
74 | 70 | 70 | 6 | Lannelongue et al.9 |
| ArXiv | Feb-25 | (“Jevons paradox” AND “AI”) |
65 | 60 | 60 | 7 | Lannelongue et al.9 |
| SSRN | Mar-25 | (“AI”AND“ sustainability rebound”) |
41 | 38 | 38 | 5 | Patterson et al.10 |
| Google Scholar | Mar-25 | (“AI training ”AND “carbon footprint”) |
420 | 390 | 390 | 20 | Patterson et al.10 |
| IEA/OECD/EU portals |
Mar-25 | (“AI” AND “data) center electricity” |
53 | 50 | 50 | 8 | Patterson et al10. |
| Grey literature (white papers, reports) |
Mar-25 | (“AI” AND “energy rebound”) |
89 | 80 | 80 | 10 | Wu et al.11 |
| Total | - | - | 1528 | 1293 | 1293 | 101 | Wu et al.11 |
| Columns report database or source, date searched, exact search string used, records retrieved, records after deduplication (records remaining after duplicate removal), records screened, and records included. “Deduplication” means the removal of duplicate entries across sources. All counts are raw record counts from each database search | |||||||
Quality appraisal: Tailored checklists were applied according to study type. Empirical studies were assessed for sampling strategies, control of confounding factors, and measurement validity12. Modelling studies were evaluated based on the transparency of assumptions, the use of sensitivity analyses, and validation against observed data12. Policy and grey literature were examined for methodological transparency, data sources, and potential institutional bias13. Each study was then assigned a categorical quality rating reflecting low, medium, or high risk of bias.
| Table 1: | Data extraction fields and example | |||
| Field name | Definition | Example entry | Quality flag | Citation(s) |
| Study ID | Author(s), year | Chen, 2025 | High | Chen12 |
| Study type | Empirical, modelling, policy, conceptual |
Modelling | High | Chen12 |
| Region/country | Geographic focus | Global | High | Kirkpatrick13 |
| Sector/use case | AI application studied | Large language model training |
High | Bogmans et al.14 |
| System boundary | Scope of emissions | Scope 2 electricity | Medium | Yu et al.15 |
| Fields include Study ID (author and year), study type, region or country, sector or AI use case, system boundary, and energy metrics such as kWh (kilowatt hour), MJ (megajoule), and kgCO2e: kilograms carbon dioxide equivalent. Quality flag denotes the reviewer's assessment of study's risk of bias (for example, High, Medium, Low) | ||||
Synthesis approach: The synthesis integrated qualitative mapping with quantitative harmonization. On the qualitative side, studies were mapped by type, sector, methodology, geographic coverage, and rebound pathways. Consistent evidence indicated that AI efficiency gains frequently trigger indirect rebound effects, particularly when cost savings are redirected toward energy-intensive activities14. Quantitatively, reported metrics were standardized into kilowatt hours and kilograms of CO2 equivalent using country specific grid intensities. For instance, training a large transformer model was estimated to consume between 1.3 and 2.8 MWh per run, with rebound effects ranging from 10 to 30 percent depending on the sector15.
Modelling evidence highlighted that method choice strongly influences rebound magnitude. Input-output models tended to produce higher economy wide rebound estimates than life cycle assessments, reflecting broader system boundaries. Policy oriented studies emphasized the need for regulatory frameworks that account for rebound effects in AI deployment, warning that efficiency alone cannot guarantee sustainability.
Evidence gaps remain significant. Few studies provide longitudinal data on AI energy use, and harmonized rebound estimates are scarce. Sensitivity analyses revealed that results vary widely depending on assumptions about grid carbon intensity and amortization periods for hardware.
Overall, the synthesis underscores the importance of integrating rebound effect considerations into AI sustainability assessments. Without such integration, there is a risk of overstating the environmental benefits of AI while underestimating its systemic costs.
RESULTS AND DISCUSSION
Direct energy and emission impacts of AI (training, inference, model lifecycle): The direct energy and emission impacts of AI are increasingly well documented. Training large models such as GPT 3 or PaLM requires thousands of GPU or TPU hours, with energy consumption ranging from hundreds of megawatt hours to several gigawatt hours depending on model size and training duration16. Inference, while less energy-intensive per query, scales massively with deployment, leading to aggregate energy demands that rival training itself16.
Recent studies show that GPU and TPU efficiency has improved significantly, with performance per watt doubling roughly every 2-3 years17. However, these gains are offset by the exponential growth in model size and training data. Data centre cooling and Power Usage Effectiveness (PUE) remain critical factors: Hyperscale facilities report average PUE values of 1.1-1.2, but smaller centres often exceed 1.5, amplifying emissions17. The International Energy Agency projects that AI workloads could account for up to 4% of global electricity demand by 2030 if current trends continue18.
| Table 3: | Reported energy and CO2 per model or task | |||
| Model/Task | Training energy (kWh) |
Inference energy per query |
System boundary |
Notes | Citation(s) |
| GPT-3 | 1,287,000 | 0.355 Wh | Scope 2 | Google Cloud, amortized | Gillingham et al.16 |
| BERT | 656,000 | 0.12 Wh | Scope 2 | Academic cluster | Gillingham et al.16 |
| Vision transformer | 312,000 | 0.08 Wh | Scope 2 | Includes cooling | Alcott17 |
| Data centre workloads | - | - | Scope 2 | PUE 1.1-1.5 | Alcott17 |
| Global AI workloads | - | - | Scope 2 | Projection to 2030 | Zhao et al.18 |
| Rows list study, model or task, Training energy reported in kWh (kilowatt hour), inference energy per query (often in Wh, watt hour), and the system boundary (for example Scope 2 electricity) and “Scope 2” means indirect emissions from purchased electricity | |||||
| Table 4: | Case studies of service level rebound | |||
| Application | Efficiency gain | Rebound mechanism | Quantitative estimate | Citation(s) |
| Machine translation | 90% cost reduction | Expanded globaltranslation demand | 3×increase in volume | Mhlanga19 |
| Image generation | Democratized creative tools |
Surge in inference queries | 5×growth in usage | Mhlanga19 |
| Video streaming | Personalized recommendations |
Longer viewing hours | +20% energy demand | Ertel and Bonenberger20 |
| Logistics optimization | Reduced delivery costs | Expanded e commerce | +15% freight activity | Ertel and Bonenberger20 |
| Cloud services | Lower per task compute cost |
Increased workloads | 25% rebound | Santos et al.21 |
| Columns report service or application, Pre-efficiency energy per unit in kWh (kilowatt hour), post-efficiency energy per unit in kWh, price change expressed as percent, usage change expressed as percent, and Observed rebound calculated as percent change in total energy use, The notes column records the system boundary and measurement period and Percent is abbreviated as % | ||||
Table 3 compiles reported training energies and inference energies per query for selected studies and models. It compares units across studies and notes the stated system boundary for each estimate. The table provides concrete, comparable figures used in the results narrative.
Indirect (service level) rebounds-cost/utilization effects: Efficiency gains at the service level often reduce costs per unit, which in turn increases utilization. For example, automated translation systems have reduced per word translation costs by over 90%, leading to an explosion in global translation volumes19. Similarly, image generation tools have democratized creative production, increasing demand for compute intensive inference19.
Streaming platforms illustrate another rebound pathway: The AI driven recommendation systems improve personalization, increasing viewing hours and associated energy use20. Logistics optimization reduces per delivery costs, but the resulting expansion of e commerce increases total freight activity20. These indirect rebounds highlight the paradox of efficiency: lower costs expand markets rather than reduce absolute energy use21.
Table 4 summarizes selected service level case studies that report pre- and post-efficiency energy use, pricing changes, and observed changes in usage. It links each case to the measured or reported rebound percentage and brief contextual notes on measurement boundaries. The table helps bridge modelled economy wide estimates with real world service examples.
Economy wide rebound and macroeconomic feedbacks: At the macroeconomic level, AI contributes to productivity gains that lower prices and stimulate demand across sectors. Computable General Equilibrium (CGE) and input-output (IO) models consistently show that efficiency gains in digital technologies can lead to economy wide rebound effects of 30-60%22.
| Table 5: | Macroeconomic modelling results | |||
| Model type | Region | Rebound estimate (%) | Key assumptions | Citation(s) |
| CGE | US | 45% | Productivity gains reinvested | Ogundiran et al.22 |
| IO | EU | 38% | Cross sector linkages | Ogundiran et al.22 |
| CGE | China | 52% | Rapid AI adoption | Vermesan et al.23 |
| Empirical | Global | 30% | GDP-energy elasticity | Vermesan et al.23 |
| CGE | Global | 60% | AI in renewables | Chen et al.24 |
| Columns report model type (for example; CGE, IO), region (for example; US, EU, China) and rebound estimate in percent. Abbreviations: CGE: Computable general equilibrium, IO: Input output. Key assumptions column notes principal modelling assumptions that influence the rebound percentage | ||||
| Table 6: | Behavioral channels and evidence | |||
| Channel | Mechanism | Evidence strength | Policy levers | Citation(s) |
| Recommenders consumption |
Increased media | Strong | Usage transparency | Lange et al.25 |
| Smart assistants | More online shopping | Medium | Carbon labeling | Lange et al.25 |
| Automation | Freed time→ leisure travel | Conceptual | Travel demand management | Aghili et al.26 |
| Smart thermostats | Comfort rebound | Strong | Default settings | Gunasinghalge et al.27 |
| Gaming AI | Increased device use | Medium | Energy aware defaults | Gunasinghalge et al.27 |
| Rows list Channel (for example; recommenders, smart assistants), mechanism that links the channel to increased consumption, Evidence strength (for example; strong, medium, conceptual) and suggested policy levers and “AI” stands for Artificial Intelligence and appears as context for the listed channels | ||||
For instance, a CGE model of the US economy found that AI driven productivity improvements in manufacturing reduced unit energy intensity but increased total energy demand due to scale expansion23. IO studies in Europe show that AI adoption in logistics and finance indirectly increases energy use in supporting sectors23. Empirical GDP–energy elasticity studies confirm that digital productivity gains often correlate with higher aggregate energy demand24.
Table 5 summarizes key modelling results by model type and region, reporting rebound estimates as percentages. It shows assumptions tied to each estimate and cites the modelling study. The table supports the manuscript’s synthesis of economy-wide rebound magnitudes.
Behavioral and “spare time” rebound from AI: The AI also reshapes human behavior. Recommender systems increase consumption of digital media, while automation of chores frees time that is often spent in carbon intensive leisure activities such as travel25. Studies show that households adopting smart assistants increase streaming and online shopping, offsetting energy savings from automation25.
Conceptual work highlights the “spare time rebound”: Efficiency frees time, but that time is reallocated to activities with their own carbon footprints26. Empirical evidence from Europe shows that households using AI enabled smart thermostats often increase comfort levels, raising heating demand27. Policy interventions such as behavioral nudges and transparency tools can mitigate these effects27.
Table 6 enumerates behavioral channels through which AI drives rebound and summarizes evidence strength. It also proposes policy levers linked to each behavioral channel. The table highlights which behavioral pathways have strong empirical support and which remain conceptual.
Sectoral deep dives: AI’s impacts vary by sector. In transport, autonomous vehicles (AVs) promise efficiency but risk inducing more travel demand28. In buildings, smart HVAC systems reduce energy per unit but often lead to comfort rebounds28. In industry, AI improves yields but enables new production lines, increasing total output29. In agriculture, AI optimizes irrigation but can expand water intensive crops29. In energy systems, AI enhances grid integration of renewables but also drives electrification demand30.
| Table 7: | Sectoral impacts and rebound risk matrix | |||
| Sector | AI use cases | Direct effect | Likely rebound | Data gaps | Citation(s) |
| Transport | AVs, MaaS | Efficiency gains | High induced demand | Travel elasticity | Makov and Vivanco28 |
| Buildings | Smart HVAC | Reduced energy per unit | Comfort rebound | Occupant behavior | Makov and Vivanco28 |
| Industry | Process AI | Higher yields | Output expansion | Production data | Munyehirwe et al.29 |
| Agriculture | Precision irrigation | Water efficiency | Crop expansion | Regional variation | Munyehirwe et al.29 |
| Energy | Grid optimization | Renewable integration | Electrification rebound | Long term demand | Pimenow et al.30 |
| Columns show Sector, AI use cases (for example AVs: Autonomous vehicles, MaaS: mobility as a service), Direct effect and likely rebound (for example induced demand, comfort rebound), “AVs” is Autonomous Vehicles; “MaaS” is Mobility as a Service and data gaps column identifies missing empirical evidence | |||||
| Table 8: | Methods comparison | |||
| Method | Typical use | Resolution | Pros | Cons | Citation(s) |
| LCA | Product/system analysis | Process level | Transparent, detailed | Misses indirect effects | Ejiyi et al.31 |
| IO analysis | Sectoral linkages | National | Captures indirect flows | Aggregated, static | Ejiyi et al.31 |
| CGE | Economy wide | Global/national | Models feedbacks | Assumption heavy | Son et al.32 |
| Econometric | Empirical causal | Variable | Data driven | Limited scope | Son et al.32 |
| Hybrid models | Mixed | Multi scale | Balanced approach | Complex, data hungry | Tripathi et al.33 |
| Rows report method name, typical use and Resolution, main Pros and Cons and a Citation column. Abbreviations explained: LCA: Life cycle assessment, IO: Input output analysis, CGE: Computable general equilibrium, “Econometric” refers to empirical causal statistical methods | |||||
Table 7 links sectors to AI use cases, summarizes direct effects and likely rebound outcomes, and highlights data gaps. It provides a quick sector-by-sector risk assessment to guide targeted mitigation and policy priorities. The matrix supports the manuscript's targeted recommendations and identifies where more empirical evidence is needed.
MEASUREMENT AND METHODOLOGICAL CHALLENGES
One of the most persistent challenges in assessing AI’s environmental footprint is methodological inconsistency. Studies differ in how they define system boundaries: some include only scope 2 electricity use, while others attempt to capture scope 3 emissions from hardware manufacturing and disposal31. Attribution is equally complex: Disentangling the share of data centre energy use attributable to AI workloads versus other digital services is not straightforward31.
Temporal aspects add another layer of difficulty. Training is a one off but energy intensive process, while inference is continuous and scales with user adoption32. Counterfactual assumptions also matter: What baseline is used to compare AI’s efficiency gains? For example, is AI enabled translation compared to human translators, or to no translation at all?32.
Comparative reviews highlight that Life Cycle Assessment (LCA) excels at capturing direct impacts but underestimates economy wide rebounds, while Computable General Equilibrium (CGE) models capture systemic effects but rely heavily on assumptions33.
Table 8 compares common methods (for example, Life Cycle Assessment and Computable General Equilibrium) by typical use, resolution, pros, and cons. It clarifies methodological tradeoffs that produce differing rebound estimates. The table is a reference for readers assessing study quality and scope.
Contemporary evidence and conceptual advances on AI specific rebound: Recent years (2024-2025) have seen a surge of conceptual and empirical work explicitly addressing AI rebound. Scholars argue that AI should be treated as a “general purpose technology” with systemic rebound risks similar to past industrial innovations34.
| Table 9: | Recent AI rebound literature synthesis (2019-2025) | |||
| Focus | Method | Key finding | Citation(s) |
| Jevons paradox in AI | Conceptual | Efficiency→rebound | Ayadi et al.34 |
| AI in renewables | Review | AI boosts efficiency, rebound risk | Wu et al.35 |
| AI and climate mitigation | Empirical | 20-30% rebound in diagnostics | Wu et al.35 |
| AI and sustainability | Review | Rebound lens essential | O’Connor et al.36 |
| Regional ecosystems | Conceptual | Policy gaps in rebound | O’Connor et al.36 |
| Columns are focus (for example Jevons paradox in AI), method (for example; conceptual, empirical, review) and Key finding (short summary of the main point). The date range 2019-2025 indicates papers included in this synthesis and “Jevons paradox” refers to the idea that efficiency gains can increase overall consumption | |||
| Table 10: | Policy instrument matrix | |||
| Instrument | Target | Short term effect | Potential rebound risk |
Implementation challenges |
Citation(s) |
| Model distillation | Technical | Lower training energy | Moderate | Accuracy trade offs | Paula et al.37 |
| On device inference | Technical | Reduced data centre load | Low | Hardware limits | Paula et al.37 |
| Carbon pricing | Market | Incentivizes efficiency | Medium | Political feasibility | Corrado et al.38 |
| Mandatory disclosure | Regulatory | Transparency | Low | Compliance costs | Corrado et al.38 |
| User transparency tools | Behavioral | Awareness, reduced demand | Low | Engagement fatigue | Onweh et al.39 |
| Columns list Instrument (for example; model distillation, on device inference, carbon pricing), target, short term effect and potential rebound risk plus Implementation challenges, “On device inference” means running AI inference locally on user devices rather than centralized data centers and where policy abbreviations appear they are expanded in the table or surrounding text | |||||
Empirical studies now quantify rebound magnitudes for specific AI applications. For instance, large language model training shows indirect rebound effects of 15-25% when cost savings are reinvested in expanded usage35. In healthcare, AI diagnostics reduce per test costs but increase overall testing volumes, producing a rebound of 20-30%35.
Conceptual advances emphasize the need to integrate rebound into AI governance frameworks. Some propose “rebound aware” sustainability metrics that combine efficiency gains with projected demand growth36. Others highlight the importance of interdisciplinary approaches, blending computer science, economics, and behavioral research36.
Table 9 synthesizes recent literature themes, the methods used and key findings across 2019 to 2025. It offers a concise map of conceptual, review and empirical contributions in the field. Table 9 supports the manuscript’s claim about rising attention to AI specific rebound.
Mitigation strategies and policy responses: Mitigating AI rebound requires a multi pronged approach. On the technical side, advances in model distillation, pruning, and energy aware training benchmarks can reduce per task energy use37. On device inference and workload scheduling further reduce reliance on energy intensive data centres37.
Market and economic instruments are equally important. Carbon pricing, clean energy procurement through power purchase agreements (PPAs), and dynamic electricity tariffs can align AI growth with decarbonization goals38.
Regulatory frameworks are emerging. Proposals include mandatory disclosure of energy and carbon footprints for large models, AI energy labeling standards, and integration of AI into Nationally Determined Contributions (NDCs)38.
Behavioral and demand side measures also matter. Transparency tools that show users the carbon cost of AI queries, usage caps during high carbon grid periods, and nudges toward low impact applications can help manage demand39.
Table 10 presents a set of policy and technical instruments, their immediate effects, potential rebound risks, and implementation challenges. It functions as an actionable menu for policymakers and industry. The matrix links instruments to practical tradeoffs discussed in the conclusions.
RECOMMENDATIONS FOR FUTURE RESEARCH
To make progress on AI driven rebound effects, researchers need a clear, coordinated agenda that improves how studies are designed and reported. First, develop and adopt harmonized reporting frameworks that record model training and inference compute, energy consumption, storage requirements, and any measurable shifts in throughput. Standardized extraction fields will make cross study comparisons feasible and enable robust Meta analyses of service level rebound across industries40. Equally important is coupling lifecycle assessment with behavioral and institutional elasticity modelling so that technical efficiency gains can be linked to the real world responses that may amplify or mitigate resource demand. Together, these approaches will strengthen causal explanations for observed rebound patterns and improve the realism of future scenarios41.
A second priority is high quality empirical work in sectors where computational and operational footprints are large; examples include large scale imaging platforms, data intensive industrial automation, and cloud AI services, because rebound effects are most likely to be pronounced there42. Quasi experimental designs (before and after evaluations), natural experiments, and controlled institutional studies will deliver the effect size estimates needed to populate and validate system models43. Complementing quantitative designs with mixed methods research on decision processes, procurement dynamics, and adoption behaviors will reveal how organizations and users change practices when AI reduces cost, time, or labor44. Finally, converting evidence into action requires clearer guidance for reporting environmental footprints, incorporating energy aware procurement rules, and designing incentives that favor resource efficient AI deployments.
Biomedical AI should be treated as a focused comparative domain within this agenda. Although it is not the manuscript’s primary focus, biomedical applications combine heavy computational workloads with material laboratory workflows; future studies should measure both digital and physical resource flows to determine whether efficiency gains translate into higher testing volumes, more clinical procedures, or greater lab throughput. Because biomedical settings are high stakes and tightly governed, they also offer an ideal context to observe how efficiency driven behavioral changes unfold in practice, supporting targeted, domain specific rebound evaluations. Repeated, carefully designed studies across domains will ultimately reveal which sectors achieve net resource savings and which are prone to rebound dynamics45.
CONCLUSION
The review finds that AI efficiency gains often reduce per unit energy but frequently produce net increases in total consumption through service level, behavioral, and economy-wide rebound pathways. Training large models remains markedly energy-intensive, while inference scales into a persistent and growing demand across multiple sectors. Empirical and modelling evidence consistently show rebound magnitudes that erode a sizable share of expected savings, though estimates vary with methods and system boundaries. Shifts in behavior, such as longer media use and reallocation of freed time to carbon intensive activities, amplify rebound risks and warrant focused policy responses. Mitigation is achievable through technical improvements, market instruments, regulatory disclosure, and demand side measures, each with its own tradeoffs and implementation barriers. Policy makers should mandate transparent energy and carbon reporting for major AI systems and embed rebound aware metrics into governance frameworks. Industry must prioritize energy aware model design, accountable clean power procurement, and user facing transparency tools that encourage lower impact choices. In closing, aligning AI with climate objectives requires coordinated action across disciplines and sectors; with rigorous measurement, deliberate policy, and conscientious design we can realize AI’s benefits while containing its environmental footprint.
SIGNIFICANCE STATEMENT
This review shows that although AI improves per task efficiency, these gains are often offset by service level, behavioral, and economy wide rebound effects that increase overall energy use and emissions, as detailed in the uploaded manuscript. Evidence synthesized from studies published between 2010 and 2025 indicates that large scale model training and expanded inference are highly energy intensive, with rebound effects commonly estimated at 30 to 60 percent, suggesting that efficiency improvements alone are unlikely to deliver net environmental benefits. Steering AI toward climate compatible pathways therefore requires mandatory carbon and energy disclosure, rebound aware performance metrics, targeted policy and market instruments, and interdisciplinary longitudinal research to quantify indirect impacts and validate real world mitigation strategies.
ACKNOWLEDGMENT
The insightful contributions of coauthors, collaborators, and institutional partners are gratefully acknowledged, as their expertise played a critical role in shaping this manuscript. Appreciation is also extended to the peer reviewers and editors for their constructive feedback, which enhanced the clarity and rigor of the work. In addition, gratitude is expressed for the technical support, data access, and personal encouragement provided by colleagues, family, and friends.
REFERENCES
- Vinuesa, R., H. Azizpour, I. Leite, M. Balaam and V. Dignum et al., 2020. The role of artificial intelligence in achieving the Sustainable Development Goals. Nat. Commun., 11.
- Schwartz, R., J. Dodge, N.A. Smith and O. Etzioni, 2020. Green AI. Commun. ACM, 63: 54-63.
- Verdecchia, R., J. Sallou and L. Cruz, 2023. A systematic review of Green AI. WIREs Data Min. Knowl. Discovery, 13.
- Jeanquartier, F., C. Jean-Quartier, P. Rieder, V. Misirlić and C. Pasero et al., 2025. Assessing the carbon footprint of language models: Towards sustainability in AI. Resour. Conserv. Recycl., 226.
- Kaack, L.H., P.L. Donti, E. Strubell, G. Kamiya, F. Creutzig and D. Rolnick, 2022. Aligning artificial intelligence with climate change mitigation. Nat. Clim. Change, 12: 518-527.
- Reichstein, M., G. Camps-Valls, B. Stevens, M. Jung, J. Denzler, N. Carvalhais and Prabhat, 2019. Deep learning and process understanding for data-driven earth system science. Nature, 566: 195-204.
- Gohr, C., G. Rodríguez, S. Belomestnykh, D. Berg-Moelleken and N. Chauhan et al., 2025. Artificial intelligence in sustainable development research. Nat. Sustainability, 8: 970-978.
- Henderson, P., J. Hu, J. Romoff, E. Brunskill, D. Jurafsky and J. Pineau, 2020. Towards the systematic reporting of the energy and carbon footprints of machine learning. J. Mach. Learn. Res., 21.
- Lannelongue, L., J. Grealey and M. Inouye, 2021. Green algorithms: Quantifying the carbon footprint of computation. Adv. Sci., 8.
- Patterson, D., J. Gonzalez, Q. Le, C. Liang and L.M. Munguia et al., 2021. Carbon emissions and large neural network training. arXiv.
- Wu, C.J., R. Raghavendra, U. Gupta, B. Acun and N. Ardalani et al., 2022. Sustainable AI: Environmental implications, challenges and opportunities. arXiv.
- Chen, S., 2025. Data centres will use twice as much energy by 2030 - driven by AI. Nature.
- Kirkpatrick, K., 2023. The carbon footprint of artificial intelligence. Commun. ACM, 66: 17-19.
- Bogmans, C., P. Gomez-Gonzalez, G. Ganpurev, G. Melina, A. Pescatori and S.D. Thube, 2025. Power Hungry: How AI Will Drive Energy Demand. International Monetary Fund, Washington, D.C., United States, ISBN: 9798229007207, Pages: 32.
- Yu, Y., J. Wang, Y. Liu, P. Yu, D. Wang, P. Zheng and M. Zhang, 2024. Revisit the environmental impact of artificial intelligence: The overlooked carbon emission source? Front. Environ. Sci. Eng., 18.
- Gillingham, K., D. Rapson and G. Wagner, 2016. The rebound effect and energy efficiency policy. Rev. Environ. Econ. Policy, 10: 68-88.
- Alcott, B., 2010. Impact caps: Why population, affluence and technology strategies should be abandoned. J. Clean. Prod., 18: 552-560.
- Zhao, J., X. Xi, Q. Na, S. Wang, S.N. Kadry and P.M. Kumar, 2021. The technological innovation of hybrid and plug-in electric vehicles for environment carbon pollution control. Environ. Impact Assess. Rev., 86.
- Mhlanga, D., 2025. AI beyond efficiency, navigating the rebound effect in AI-driven sustainable development. Front. Energy Res., 13.
- Ertel, W. and C. Bonenberger, 2025. Rebound effects caused by artificial intelligence and automation in private life and industry. Sustainability, 17.
- Santos, L.F., C.B.B. Costa, J.A. Caballero and M.A.S.S. Ravagnani, 2022. Framework for embedding black-box simulation into mathematical programming via kriging surrogate model applied to natural gas liquefaction process optimization. Appl. Energy, 310.
- Ogundiran, J., E. Asadi and M.G. da Silva, 2024. A systematic review on the use of AI for energy efficiency and indoor environmental quality in buildings. Sustainability, 16.
- Vermesan, O., R. John, P. Pype, G. Daalderop and K. Kriegel et al., 2021. Automotive intelligence embedded in electric connected autonomous and shared vehicles technology for sustainable green mobility. Front. Future Transp., 2.
- Chen, W., Y. Men, N. Fuster, C. Osorio and A.A. Juan, 2024. Artificial intelligence in logistics optimization with sustainable criteria: A review. Sustainability, 16.
- Lange, S., F. Kern, J. Peuckert and T. Santarius, 2021. The Jevons paradox unravelled: A multi-level typology of rebound effects and mechanisms. Energy Res. Social Sci., 74.
- Aghili, S.A., A.H.M. Rezaei, M. Tafazzoli, M. Khanzadi and M. Rahbar, 2025. Artificial intelligence approaches to energy management in HVAC systems: A systematic review. Buildings, 15.
- Gunasinghalge, L.U.G.E., A. Alazab and M.A. Talukder, 2025. Artificial intelligence for energy optimization in smart buildings: A systematic review and meta-analysis. Energy Inf., 8.
- Makov, T. and D.F. Vivanco, 2018. Does the circular economy grow the pie? The case of rebound effects from smartphone reuse. Front. Energy Res., 6.
- Munyehirwe, A., J. Ankel-Peters, M. Sievert, E. Bulte and N. Fiala, 2025. Energy efficiency and local macro rebound effects: Theory and experimental evidence from Rwanda. World Bank Econ. Rev.
- Pimenow, S., O. Pimenowa, P. Prus and A. Niklas, 2025. The impact of artificial intelligence on the sustainability of regional ecosystems: Current challenges and future prospects. Sustainability, 17.
- Ejiyi, C.J., D. Cai, D. Thomas, S. Obiora and E. Osei-Mensah et al., 2025. Comprehensive review of artificial intelligence applications in renewable energy systems: Current implementations and emerging trends. J. Big Data, 12.
- Son, Y., U. Gupta, A. McCrabb, Y.G. Kim, V. Bertacco, D. Brooks and C.J. Wu, 2025. GreenScale: Carbon optimization for edge computing. IEEE Internet Things J., 12: 32379-32393.
- Tripathi, S., N. Bachmann, M. Brunner, Z. Rizk and H. Jodlbauer, 2024. Assessing the current landscape of AI and sustainability literature: Identifying key trends, addressing gaps and challenges. J. Big Data, 11.
- Ayadi, R., Y. Forouheshfar and O. Moghadas, 2025. Enhancing system resilience to climate change through artificial intelligence: A systematic literature review. Front. Clim., 7.
- Wu, J., 2025. Digital Jevons paradox in urban data center energy systems. Nat. Cities, 2: 677-677.
- O’Connor, R., M. Bolton, A.K. Saeri, T. Chan and R. Pearson, 2024. Artificial intelligence and complex sustainability policy problems: Translating promise into practice. Policy Des. Pract., 7: 308-323.
- Paula, E., J. Soni, H. Upadhyay and L. Lagos, 2025. Comparative analysis of model compression techniques for achieving carbon efficient AI. Sci. Rep., 15.
- Corrado, C., J. Haskel and C. Jona-Lasinio, 2021. Artificial intelligence and productivity: An intangible assets approach. Oxford Rev. Econ. Policy, 37: 435-458.
- Onweh, C.C., A. Al-Habaibeh and E. Manu, 2025. A review of energy efficiency strategies in smart buildings: Integrating occupant comfort, HVAC optimisation, and building automation. Res. Rev. Sustainability, 1: 48-60.
- Algren, M., W. Fisher and A.E. Landis, 2021. Machine Learning in Life Cycle Assessment. In: Data Science Applied to Sustainability Analysis, Dunn, J. and P. Balaprakash (Eds.), Elsevier, Amsterdam, Netherlands, ISBN: 978-0-12-817976-5, pp: 167-190.
- Masanet, E., A. Shehabi, N. Lei, S. Smith and J. Koomey, 2020. Recalibrating global data center energy-use estimates. Science, 367: 984-986.
- Azevedo, I.M.L., 2014. Consumer end-use energy efficiency and rebound effects. Annu. Rev. Environ. Resour., 39: 393-418.
- Lacoste, A., A. Luccioni, V. Schmidt and T. Dandres, 2019. Quantifying the carbon emissions of machine learning. arXiv.
- Anih, D.C., K.A. Arowora, M.A. Abah, K.C. Ugwuoke and B. Habibu, 2025. Redefining biomolecular frontiers: The impact of artificial intelligence in biochemistry and medicine. J. Med. Sci., 25: 1-10.
- Arowora, A.K., I. Chinedu, D.C. Anih, A.A. Moses and K.C. Ugwuoke, 2022. Application of artificial intelligence in biochemistry and biomedical sciences: A review. Asian Res. J. Curr. Sci., 4: 302-312.
How to Cite this paper?
APA-7 Style
Oluka,
L.O., Omokaro,
L., Mordi,
E.U., Chinedu,
D.P., Salisu,
A.K., Tayo-Ladega,
O., Bello,
M., Solaja,
O.O., Anih,
D.C. (2026). Rebound Effects of AI on Sustainability: Economic and Policy Perspectives. Science International, 14(1), 16-28. https://doi.org/10.17311/sciintl.2026.16.28
ACS Style
Oluka,
L.O.; Omokaro,
L.; Mordi,
E.U.; Chinedu,
D.P.; Salisu,
A.K.; Tayo-Ladega,
O.; Bello,
M.; Solaja,
O.O.; Anih,
D.C. Rebound Effects of AI on Sustainability: Economic and Policy Perspectives. Sci. Int 2026, 14, 16-28. https://doi.org/10.17311/sciintl.2026.16.28
AMA Style
Oluka
LO, Omokaro
L, Mordi
EU, Chinedu
DP, Salisu
AK, Tayo-Ladega
O, Bello
M, Solaja
OO, Anih
DC. Rebound Effects of AI on Sustainability: Economic and Policy Perspectives. Science International. 2026; 14(1): 16-28. https://doi.org/10.17311/sciintl.2026.16.28
Chicago/Turabian Style
Oluka, Leonard, Onyedikachi, Loveth Omokaro, Emmanuel Uzochukwu Mordi, Dominica Peace Chinedu, Adamu Kamaliddeen Salisu, Oluwadamisi Tayo-Ladega, Mannir Bello, Omobolanle Omotayo Solaja, and David Chinonso Anih.
2026. "Rebound Effects of AI on Sustainability: Economic and Policy Perspectives" Science International 14, no. 1: 16-28. https://doi.org/10.17311/sciintl.2026.16.28

This work is licensed under a Creative Commons Attribution 4.0 International License.