Spatiotemporal Analysis of Road Network Expansion and its Impact on Carbon Emissions, Built-Up Area, and Rainfall Patterns: A Case Study (2014-2023)
-
Shumaila Naz


University of Karachi, Karachi, Pakistan
Saqib ur RehmanUniversity of Karachi, Karachi, Pakistan
| Received 27 Mar, 2025 |
Accepted 12 Aug, 2025 |
Published 13 Aug, 2025 |
Background and Objective: Urban expansion and environmental changes in Dhaka over the past decade have significantly transformed its landscape, impacting road networks, built-up areas, rainfall patterns, and carbon emissions. This study analyzes these key factors using spatial data to understand their environmental and socio-economic implications. Materials and Methods: This study examined urban expansion, rainfall patterns, and CO2 emissions in Dhaka from 2014 to 2023 using geospatial data. Datasets from OSM, CHIRPS, and EDGAR were analyzed using ArcGIS and MATLAB. Spatial changes were visualized through network analysis, emission mapping, and hotspot detection. Results: The findings reveal a substantial increase in the road network, enhancing connectivity but also contributing to traffic congestion and rising emissions. The built-up area has expanded rapidly, replacing green spaces with urban infrastructure, intensifying the urban heat island effect, and increasing energy demands. Changes in rainfall patterns indicate a shift in microclimate conditions, affecting air quality and exacerbating urban flooding due to reduced natural infiltration. The carbon emissions have significantly risen, driven by increased vehicular movement, industrialization, and deforestation, leading to severe air pollution and climate instability. These trends highlight the urgent need for sustainable urban planning, emission control policies, and green infrastructure development to mitigate environmental degradation. Conclusion: This study emphasizes the importance of integrating renewable energy solutions, enhancing public transport systems, and adopting eco-friendly urban expansion strategies to ensure a balanced and sustainable future for Dhaka.
| Copyright © 2025 Naz and Rehman. This is an open-access article distributed under the Creative Commons Attribution License, which permits unrestricted use, distribution, and reproduction in any medium, provided the original work is properly cited. |
INTRODUCTION
Urbanization significantly influences environmental dynamics, particularly in rapidly developing regions. The expansion of built-up areas often leads to profound land use changes, threatening biodiversity, diminishing ecosystem services, and contributing to regional climate instability1. Global projections suggest that by 2030, urban expansion may cause substantial losses in carbon stocks and biodiversity, with developing countries bearing the brunt of these impacts¹. Dhaka, one of the fastest-growing megacities in South Asia, exemplifies these challenges. Rapid urban growth has drastically transformed land use patterns, reduced vegetation cover, and led to a measurable decline in ecosystem service value2. Among the drivers of this transformation, road infrastructure development plays a pivotal role in facilitating urban connectivity and economic growth. However, it also contributes to habitat fragmentation, altered hydrological systems, pollution, and the introduction of invasive species3. Additionally, transportation and urban expansion are closely linked to rising carbon emissions, primarily due to increased vehicular traffic, energy use, and industrial activity4. Although several studies have explored individual aspects of urbanization, limited research has examined the combined influence of road network expansion on land use transformation, emissions, and local climate interactions. This study addresses that gap by analyzing how road infrastructure growth from 2014 to 2023 in Dhaka has influenced carbon emissions, built-up area expansion, and rainfall patterns. The findings aim to inform integrated urban planning strategies that balance development with environmental sustainability.
MATERIALS AND METHODS
Study area and timeframe: This study focuses on Dhaka, Bangladesh, analyzing spatiotemporal changes from 2014 to 2023. As one of the fastest-growing megacities in South Asia, Dhaka provides a valuable case for evaluating urbanization’s environmental impact.
Data sources: Three key datasets were utilized:
| • | Road networks and built-up areas: Obtained from OpenStreetMap (OSM), providing high-resolution vector data for analyzing road hierarchies and urban development patterns | |
| • | Rainfall data: Sourced from the climate hazards group infrared precipitation with station data (CHIRPS), a globally validated gridded rainfall dataset commonly used for climate and hydrological studies in developing regions5 | |
| • | Carbon emissions: Derived from the Emissions Database for Global Atmospheric Research (EDGAR), which offers high-resolution, sector-specific CO2 emission inventories6 |
Data processing and analysis
Road network and urban expansion: The OSM shapefiles were imported into ArcGIS 10.8. Road types were classified by hierarchy (e.g., primary, secondary), and built-up areas were categorized based on urban density thresholds. Network analysis and urban growth modeling techniques were adapted from previous methods, which are standard in spatiotemporal urban studies7,8:
| • | Urban expansion was quantified through overlay analysis of urban footprints from 2014 and 2023 | |
| • | Rainfall analysis: CHIRPS NetCDF files were processed using MATLAB R2022b, where rainfall data were clipped to the Dhaka boundary, averaged seasonally, and visualized as anomaly trends. This approach is based on methodologies outlined by Funk et al.5 for CHIRPS processing in hydrological studies | |
| • | Carbon emissions analysis: EDGAR v6.0 data were filtered for Dhaka’s spatial extent and disaggregated by sector (e.g., transportation, residential, industry). Emissions were spatially interpolated using inverse distance weighting (IDW) in ArcGIS to produce emission density maps, following the method used in Crippa et al.6 for sub-national CO2 mapping |
Integration and visualization: All datasets were integrated into ArcGIS for overlay and comparative analysis. Final outputs include maps depicting road network changes, built-up area growth, rainfall patterns, and CO2 emission distributions, along with hotspot analyses. All datasets were integrated into ArcGIS for visualization and comparative analysis.
RESULTS
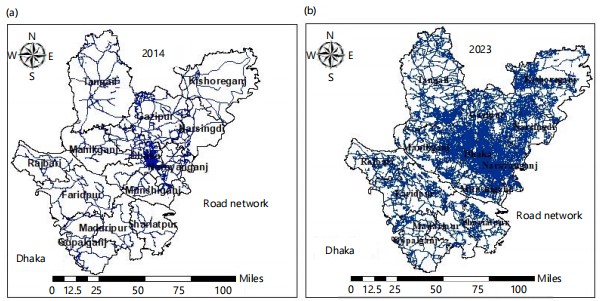
A comparative assessment of changes in carbon emissions, road network expansion, built-up area growth, and rainfall patterns between 2014 and 2023 reveals the significant transformations that have occurred in Dhaka. The spatial distribution analysis highlights the rapid pace of urbanization, increased transportation activity, and the resulting environmental challenges that have emerged over the past decade. The transformation of Dhaka’s road network between 2014 and 2023 highlights the city’s rapid infrastructure development and urbanization. By examining changes in transportation growth and connectivity improvements, this analysis provides insights into the environmental impact of road expansion and its broader implications for sustainable urban planning.
|
Figure 1a illustrates the spatial distribution and expansion of the road network over a decade. The data, sourced from OSM, showcases key transportation corridors, major highways, and newly developed roads. The network is categorized into primary roads, secondary roads, and local streets, facilitating a comparative analysis of urban connectivity. In 2014, the road network was relatively sparse, with a well-established primary road system but limited connectivity in suburban and peri-urban areas. Most road infrastructure was concentrated in the urban core, with major highways and arterial roads serving as primary transportation routes. Peripheral had fewer roads, restricting access to rapidly growing regions. The absence of smaller connecting roads led to traffic congestion in high-density areas due to a lack of alternative routes. Additionally, built-up areas were relatively smaller, with undeveloped or semi-developed regions lacking a structured road network, which further limited restricting accessibility to potential new urban zones. By 2023, as seen in Fig. 1b, the road network had expanded significantly due to urban sprawl, population growth, and increasing mobility demands. A denser and more extensive road network emerged, particularly in suburban and peri-urban areas, enhancing connectivity and enabling urban expansion. New road extensions and bypasses were developed to accommodate rising vehicular traffic and reduce congestion in the city core. Unlike in 2014, where primary roads dominated, the 2023 network included a greater number of secondary and tertiary roads, facilitating smoother intra-city transportation. Neighborhood-level road expansions improved accessibility, boosting real estate development and economic activities in emerging urban zones. The expansion of the road network aligned with the growth of built-up areas, providing essential infrastructure to support commercial, residential, and industrial development. Major construction projects, including highway extensions, new intersections, and widened s treets, were implemented to manage the increased volume of vehicles. Overall, the expansion of Dhaka’s road network reflects the city’s rapid urbanization and the growing need for improved mobility solutions. While these developments have enhanced connectivity and accessibility, they also raise concerns about environmental sustainability and urban planning challenges.
|
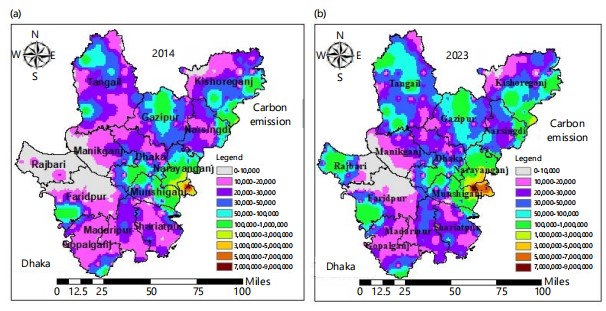
Figure 2a illustrates the spatial distribution of carbon emissions across the study area over ten years (2014-2023). The data, sourced from the Emissions Database for Global Atmospheric Research (EDGAR), has been processed and mapped using ArcGIS to visualize emission intensity and spatial patterns. In 2014, carbon emissions were moderate, primarily concentrated in industrial zones, transportation corridors, and high-density urban areas. The industrial sector significantly contributed to emissions, but its expansion was limited compared to later years. Energy production relied heavily on coal and fossil fuels, particularly in industrial zones, leading to localized pollution hotspots. Additionally, the road network in 2014 was less developed, resulting in lower vehicle numbers and reduced emissions from the transportation sector. By 2023, in Fig. 2b, carbon emissions increased sharply due to rapid urbanization, industrial expansion, and transportation growth. Industrialization led to higher energy consumption across manufacturing, production plants, and commercial activities, while continued reliance on fossil fuels contributed to rising emissions. The expansion of the road network facilitated a higher number of vehicles, significantly increasing emissions. Traffic congestion and inefficient fuel use led to localized pollution hotspots, particularly in urban centers and along highways. A comparative analysis of 2014 and 2023 highlights the impact of urbanization, industrialization, and transport expansion on atmospheric pollution levels. While economic growth and infrastructure development have accelerated, they have also significantly contributed to higher carbon footprints, deteriorating air quality, and climate instability. The overlay of the road network on the emission maps reveals that carbon emissions have intensified along major transportation routes. In 2014, emissions were more dispersed and lower in magnitude, whereas in 2023, road-centric emissions became more pronounced, forming dense pollution clusters along highways and urban roads. This trend indicates that vehicular pollution has become a dominant factor in rising carbon emissions, exacerbated by rapid population growth and increased vehicle ownership over the past decade. To mitigate the environmental consequences of rising emissions, sustainable policy interventions and improved urban planning are essential. Key strategies include investment in public transportation to reduce vehicle dependency, implementing stricter emission control policies, promoting green energy initiatives to decrease reliance on fossil fuels, and encouraging cleaner fuel technologies such as electric or hybrid vehicles. Balancing economic development with environmental sustainability is crucial for ensuring improved air quality and long-term climate stability. The expansion of urban areas is a crucial indicator of socioeconomic progress, and analyzing the changes in built-up regions between 2014 and 2023 provides valuable insights into the transformation of land use patterns. The spatial analysis highlights the rapid urbanization process, emphasizing its driving factors, associated challenges, and environmental consequences.
|
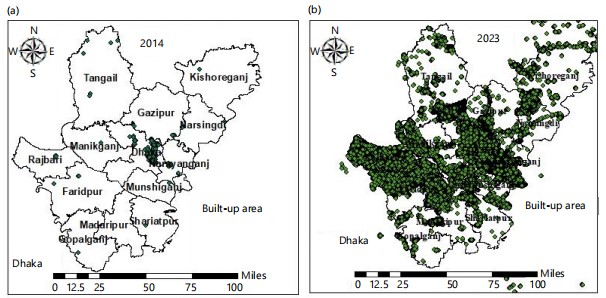
As illustrated in Fig. 3(a), the built-up area in Dhaka was significantly smaller in 2014, with urban development primarily concentrated in central districts and major towns. Surrounding regions remained largely undeveloped, consisting of agricultural land, open spaces, and natural landscapes. During this period, urban growth was relatively controlled, with distinct separations between residential, commercial, and industrial zones. The demand for land was moderate, resulting in a compact city structure with limited suburban expansion. Additionally, weak road connectivity hindered extensive development beyond the city core, as reflected in the 2014 road network. By 2023, in Fig. 3b, urban expansion had intensified dramatically, driven by population growth, economic activities, and large-scale infrastructure development. The built-up area expanded beyond the original city boundaries, transforming peri-urban and rural zones into urban landscapes. This expansion absorbed agricultural land, wetlands, and open fields, reducing green spaces and increasing environmental pressures. Informal settlements and high-density residential projects surged in response to growing housing demands, while commercial and industrial sectors extended outward, shifting land use patterns from agricultural to urbanized areas. The expansion of the road network facilitated this rapid urban sprawl, enabling the spread of residential, commercial, and industrial hubs. The environmental impact of this urbanization is evident in Figure 3. In 2014, a smaller built-up area resulted in lower emissions from construction, energy use, and human activities. Green spaces played a crucial role in carbon sequestration, mitigating pollution. However, by 2023, the widespread expansion of built-up areas led to increased emissions from construction, heating, industrial activities, and transportation. The loss of green spaces reduced the land’s ability to absorb carbon dioxide, intensifying pollution levels and worsening air quality. The comparison of built-up areas between 2014 and 2023 underscores the rapid urbanization and infrastructural growth that have fueled economic development while also presenting serious environmental challenges. The alignment of high-emission zones with newly urbanized areas suggests a direct relationship between urban sprawl and rising carbon emissions. As Dhaka continues to expand, sustainable urban planning policies are essential to balance growth with environmental preservation, ensuring that future development does not come at the cost of severe ecological degradation. Rainfall patterns play a crucial role in urban hydrology, water resource management, and climate stability. The comparison of rainfall trends in 2014 and 2023 provides insights into how urbanization, land-use changes, and climate variability have influenced precipitation patterns over the past decade. Fig. 4 (Rainfall Distribution for 2014 and 2023) highlights these changes, showing variations in intensity, spatial distribution, and seasonal shifts.
|
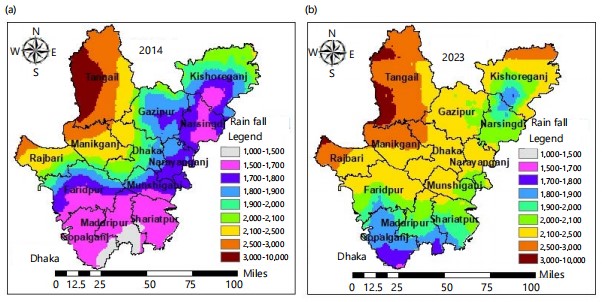
Figure 4a illustrates the spatial and temporal distribution of rainfall over the study area for the ten years (2014-2023). The data, sourced from CHIRPS (Climate Hazards Group Infrared Precipitation with Station Data), has been processed using MATLAB and visualized in ArcGIS to highlight regional variations in precipitation patterns.
In 2014, rainfall was relatively stable, following expected seasonal monsoon cycles. The key characteristics observed in the 2014 rainfall distribution include:
| • | Moderate and well-distributed rainfall: Rainfall was evenly distributed across different regions, with no extreme variations | |
| • | Higher rainfall in coastal and low-lying areas: Due to natural climatic conditions and geographical factors, coastal and low-lying regions received higher rainfall, supporting green cover | |
| • | Impact of built-up area and land use less urbanization impact: The smaller built-up area (Fig. 3, 2014) meant that natural water absorption was efficient, reducing runoff and flash floods | |
| • | Higher groundwater recharge: With more open spaces and vegetation, rainfall percolated into groundwater reserves, replenishing water tables | |
| • | Lower carbon emissions: As illustrates in Fig. 2 (2014) less pollution-induced changes in rainfall patterns | |
| • | Minimal urban heat island effect: Due to lower urban sprawl, temperature variations were natural, allowing normal rainfall formation | |
| • | Predictable monsoon cycles: Seasonal rainfall followed a stable pattern, with monsoon rains occurring at expected times | |
| • | Lower extreme weather events: No significant variations in heavy rainfall or drought periods were observed |
By 2023, in Fig. 4b rainfall patterns had undergone significant changes, influenced by urban expansion, climate shifts, and increased carbon emissions. The rainfall characteristics in 2023 (Fig. 4) indicate a more erratic and uneven distribution of precipitation:
| • | Spatial distribution and rainfall intensity irregular rainfall patterns: Unlike 2014, rainfall became more unpredictable, with some areas experiencing intense rainfall while others faced dry conditions | |
| • | Urban flooding risks increased: Due to rapid urbanization (Fig. 3, 2023), impermeable surfaces led to higher runoff and flash floods in urban centers | |
| • | Loss of green spaces: The expansion of built-up areas reduced the natural absorption capacity of land, causing more surface runoff | |
| • | Groundwater recharge declined: Due to reduced open spaces, rainwater was unable to seep into the soil, leading to water scarcity issues in non-monsoon months | |
| • | Higher carbon emissions: In Fig. 4 (2023) impacted cloud formation and precipitation | |
| • | Urban heat island effect intensified: Increased temperature variations due to expanded urbanization altered rainfall patterns, contributing to heavier downpours in some areas and dry conditions in others | |
| • | Unpredictable monsoons: Unlike 2014, monsoon onset and withdrawal became irregular, leading to delayed or excessive rainfall periods | |
| • | Frequent heavy rainfall events: Shorter but intense rainfall episodes increased, resulting in urban drainage challenges and flooding |
Rainfall plays a crucial role in mitigating carbon emissions by cleansing pollutants from the atmosphere. However, changes in precipitation trends over the past decade have influenced emission levels. The figure suggest that areas experiencing reduced rainfall have higher carbon concentrations, while regions with more frequent precipitation show lower emission densities. Several climatic factors may have contributed to altered rainfall patterns, including urban heat island effects, deforestation, and global climate change. The following trends are evident, Regions with high emissions in 2023 correspond to areas with reduced rainfall, suggesting a weakened natural cleansing process. Urbanization-induced temperature changes may have affected local precipitation patterns. Flood-prone areas have seen changes in runoff patterns, potentially increasing aerosol suspension in the air.
Flooding and drainage issues: As impermeable surfaces increase due to urbanization, rainwater runoff has intensified, exacerbating urban flooding risks (Fig. 3, Rainfall Trends).
DISCUSSION
This study revealed that between 2014 and 2023, Dhaka experienced rapid urban expansion, significant increases in road network density, altered rainfall patterns, and rising carbon emissions, all of which reflect the environmental costs of unplanned urbanization. The analysis demonstrated that urban areas have spread outward from the city core, primarily converting green cover and peri-urban lands into built-up zones. Road networks have become denser, particularly in the northern and southeastern corridors, contributing to higher vehicular movement and associated emissions. Concurrently, spatial rainfall anomalies suggest a localized influence of land-use changes on precipitation dynamics, and carbon emission hotspots have intensified near industrial clusters and congested transportation zones. The observed urban expansion is consistent with global trends in rapidly growing cities, where population pressure and economic development drive land transformation1. Similar findings were reported by Seto et al.1, who projected that global urban land cover will triple between 2000 and 2030, primarily in Asia and Africa, leading to biodiversity loss and increased carbon pools. In Dhaka, Rahman and Szabó2 reported that urban land cover increased by over 60% between 2000 and 2018, echoing the urban sprawl quantified in the present study. The densification of the road network observed aligns with Forman and Alexander3, who noted that roads are both facilitators and disruptors of ecological processes, contributing to habitat fragmentation and vehicular pollution. The emission density analysis in this study is reinforced by Guan et al.4, who demonstrated how urbanization in developing economies often leads to exponential increases in CO2 emissions due to energy-intensive growth. Similar patterns have been observed in South Asian cities like Delhi and Kolkata, where unregulated transportation and industrialization contribute significantly to urban emissions. Moreover, this study’s rainfall trend analysis complements the work of Funk et al.5, who highlighted that urban heat islands can modify mesoscale meteorological patterns, potentially altering precipitation intensity and distribution5. A recent study found similar localized climate shifts in fast-growing Southeast Asian cities, attributing rainfall variability to surface energy imbalances induced by land cover change. The findings also reflect the lack of integrated urban and environmental planning in Dhaka. The unchecked urban growth observed in this study mirrors the concerns raised by researchers who reported that over 80% of Dhaka’s urban growth between 2001 and 2019 occurred without formal zoning or environmental impact assessment. Furthermore, the spatial distribution of emission hotspots supports that Dhaka’s CO2 emissions are closely tied to transportation density and industrial clustering. Despite these important insights, the study has several limitations. First, the spatial resolution of emissions data, while useful for trend detection, may not capture micro-level variations such as emissions from informal settlements or small-scale industries. Second, while CHIRPS rainfall data offer good temporal coverage, integrating in situ rainfall stations could improve accuracy. Third, socio-economic data, such as income levels or household energy usage, were not incorporated, which limits the scope of causal inferences. Future research should integrate high-resolution environmental data, machine learning-based urban classification models7, and climate adaptation indicators to develop a more comprehensive understanding of urban-environment interactions. Collaborative urban governance frameworks will also be critical to addressing the environmental challenges highlighted in this study. Despite the potential solutions, several limitations and challenges must be acknowledged in the pursuit of sustainable urban development in Dhaka. One major limitation is the financial constraints that may hinder the execution of large-scale sustainability projects, such as the development of extensive green infrastructure or the adoption of cleaner energy alternatives. Additionally, weak governance and poor enforcement of environmental policies remain significant obstacles, as regulatory frameworks often fail to achieve their intended objectives due to corruption and inefficiency. Another major challenge is the limited public awareness and willingness to adopt sustainable practices, which slows the shift towards greener alternatives.
CONCLUSION
This study provides a comprehensive spatiotemporal assessment of Dhaka’s urban growth and its environmental consequences from 2014 to 2023. By integrating multi-source geospatial datasets, including road network data from OpenStreetMap (OSM), rainfall data from CHIRPS, and carbon emissions data from EDGAR, this research reveals the interconnected impacts of unplanned urbanization on land use, emissions, and climate patterns. The analysis demonstrates that Dhaka has undergone significant urban expansion, marked by increased road density, loss of green spaces, rising carbon emissions, and altered rainfall dynamics. These transformations are primarily driven by population pressure, economic development, and insufficient regulatory oversight. The spatial alignment of built-up areas, emission hotspots, and rainfall anomalies underscores the need for integrated urban and environmental planning. The findings highlight the urgent need for policy interventions focused on sustainable transportation, emissions control, land-use planning, and climate adaptation. Without deliberate efforts to balance growth with environmental sustainability, Dhaka risks further degradation of air quality, increased flood risks, and long-term climate instability. Moving forward, urban development must be guided by data-driven planning frameworks that prioritize environmental resilience, energy efficiency, and green infrastructure. Collaboration among policymakers, researchers, and local stakeholders will be crucial to achieving a more sustainable and livable future for Dhaka and similar rapidly urbanizing cities in South Asia.
SIGNIFICANCE STATEMENT
Urbanization in rapidly growing cities like Dhaka is driving profound environmental transformations, yet its cumulative impact on carbon emissions, rainfall variability, and infrastructure development remains underexplored. This study presents a decade-long spatial analysis revealing how urban expansion and road network growth are closely linked to increased carbon emissions and shifts in local rainfall patterns. By integrating satellite data and GIS tools, the research offers a comprehensive view of urban-environment interactions. These findings are crucial for informing sustainable urban planning and climate resilience strategies in South Asia and other developing regions facing similar growth challenges.
REFERENCES
- Seto, K.C., B. Güneralp and L.R. Hutyra, 2012. Global forecasts of urban expansion to 2030 and direct impacts on biodiversity and carbon pools. Proc. Natl. Acad. Sci. U.S.A., 109: 16083-16088.
- Rahman, M. and G. Szabó, 2021. Impact of land use and land cover changes on urban ecosystem service value in Dhaka, Bangladesh. Land, 10.
- Forman, R.T.T. and L.E. Alexander, 1998. Roads and their major ecological effects. Ann. Rev. Ecol. Syst., 29: 207-231.
- Guan, D., G.P. Peters, C.L. Weber and K. Hubacek, 2009. Journey to world top emitter: An analysis of the driving forces of China's recent CO2 emissions surge. Geophys. Res. Lett., 36.
- Funk, C., P. Peterson, M. Landsfeld, D. Pedreros and J. Verdin et al., 2015. The climate hazards infrared precipitation with stations-A new environmental record for monitoring extremes. Sci. Data, 2.
- Crippa, M., E. Solazzo, G. Huang, D. Guizzardi and E. Koffi et al., 2020. High resolution temporal profiles in the emissions database for global atmospheric research. Sci. Data, 7.
- Esch, T., M. Marconcini, A. Felbier, A. Roth and W. Heldens et al., 2013. Urban footprint processor-fully automated processing chain generating settlement masks from global data of the TanDEM-X mission. IEEE Geosci. Remote Sens. Lett., 10: 1617-1621.
- Herold, M., N.C. Goldstein and K.C. Clarke, 2003. The spatiotemporal form of urban growth: Measurement, analysis and modeling. Remote Sens. Environ., 86: 286-302.
How to Cite this paper?
APA-7 Style
Naz,
S., Rehman,
S.u. (2025). Spatiotemporal Analysis of Road Network Expansion and its Impact on Carbon Emissions, Built-Up Area, and Rainfall Patterns: A Case Study (2014-2023). Science International, 13(1), 81-89. https://doi.org/10.17311/sciintl.2025.81.89
ACS Style
Naz,
S.; Rehman,
S.u. Spatiotemporal Analysis of Road Network Expansion and its Impact on Carbon Emissions, Built-Up Area, and Rainfall Patterns: A Case Study (2014-2023). Sci. Int 2025, 13, 81-89. https://doi.org/10.17311/sciintl.2025.81.89
AMA Style
Naz
S, Rehman
Su. Spatiotemporal Analysis of Road Network Expansion and its Impact on Carbon Emissions, Built-Up Area, and Rainfall Patterns: A Case Study (2014-2023). Science International. 2025; 13(1): 81-89. https://doi.org/10.17311/sciintl.2025.81.89
Chicago/Turabian Style
Naz, Shumaila, and Saqib ur Rehman.
2025. "Spatiotemporal Analysis of Road Network Expansion and its Impact on Carbon Emissions, Built-Up Area, and Rainfall Patterns: A Case Study (2014-2023)" Science International 13, no. 1: 81-89. https://doi.org/10.17311/sciintl.2025.81.89

This work is licensed under a Creative Commons Attribution 4.0 International License.